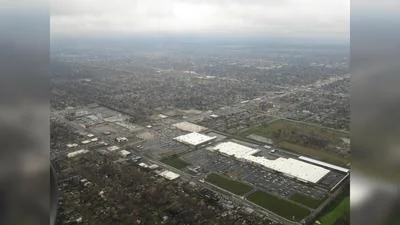
That's an increase of 66.4 percent from 2014, when the village spent $2.54 million, or $5,060.36 per household.
Cambria has 501 households and a population of 1,228.
Since 2001, the Village of Cambria budget has grown by 307.8 percent, from $1.03 million. The village population has fallen 7.7 percent over the same period, from 1,330.
Salaries accounted for 5.9 percent of village spending in 2015. Cambria property taxpayers paid $249,379.80 for three full-time employees and eight part-time employees.
In 2001, the village had three full-time employees and 10 part-time employees, and spent $199,389.80.
Year
Population
Budget
Salaries
Salary %
# Employees
$$ Per Employee
2015
1,228
$4,218,893.40
$249,379.80
5.9
11
$22,670.89
2014
1,228
$2,535,242
$244,424.15
9.6
11
$22,220.37
2013
1,228
$2,334,176
$225,391.92
9.7
11
$20,490.17
2012
1,228
$2,299,034
$258,396.20
11.2
11
$23,490.56
2010
1,330
$2,093,349
$261,094.20
12.5
11
$23,735.83
2009
1,330
$2,720,927
$240,398.46
8.8
11
$21,854.40
2008
1,330
$2,551,427
$247,079.02
9.7
11
$22,461.72
2007
1,330
$2,607,438.60
$236,187.90
9.1
12
$19,682.32
2006
1,330
$2,226,090
$235,538.40
10.6
12
$19,628.19
2005
1,330
$2,241,300
$221,953.80
9.9
13
$17,073.36
2004
1,330
$2,260,788.21
$225,884.16
10
12
$18,823.68
2003
1,330
$2,353,257.72
$216,846.96
9.2
12
$18,070.57
2002
1,330
$2,541,740.85
$202,093.65
8
13
$15,545.66
2001
1,330
$1,034,521.25
$199,389.80
19.3
13
$15,337.67
All values in this story are inflation-adjusted real values.


 Alerts Sign-up