
The CTA calculates ridership by counting the customers who board a transit vehicle (bus or rail).
The Soldier Field Express route saw the largest increase in ridership with a 115.1% rise.
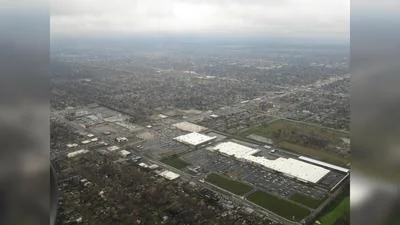
Bus and train traffic took a serious hit during the pandemic. The Metra, which provides service to many of Chicago's suburbs, saw a 97% decrease in ridership according to the Active Transportation Alliance. According to the Federal Transit Authority, Chicago's public transportation sector received $1.43 billion in bailout funds from the CARES act to combat the decrease in ridership.
While ridership hasn't returned to pre-pandemic levels, CTA's president Dorval R. Cart Jr. said weekday ridership has doubled since the initial shutdown and continues to increase.
| Rank | Route | Ridership increase from 2021 to 2022 (%) |
|---|---|---|
| 1 | Soldier Field Express | 115.1 |
| 2 | Clarendon/LaSalle Express | 74.7 |
| 3 | Stockton/LaSalle Express | 70.4 |
| 4 | Sedgwick | 58.8 |
| 5 | Lunt | 45.9 |
| 6 | Sheridan/LaSalle Express | 42.8 |
| 7 | 31st | 38.8 |
| 8 | Harrison | 34.8 |
| 9 | Bronzeville/Union Station | 34.7 |
| 9 | LaSalle | 34.7 |
| 11 | Lincoln | 31 |
| 12 | Western Express | 29.4 |
| 13 | West Lawrence | 26 |
| 13 | Streeterville/Taylor | 26 |
| 15 | Navy Pier | 23.9 |
| 16 | Central/Ridge | 23.6 |
| 17 | Clarendon/Michigan Express | 21.8 |
| 18 | Narragansett/Ridgeland | 21.6 |
| 19 | 51st | 21.2 |
| 20 | Halsted | 20.4 |
| 21 | East 103rd | 20.2 |
| 22 | Wallace-Racine | 19.8 |
| 23 | 55th/Narragansett | 19.5 |
| 24 | Inner Lake Shore/Michigan Expr | 18.4 |
| 25 | Madison | 18.3 |
| 25 | Sheridan | 18.3 |
| 27 | 59th/61st | 18.1 |
| 28 | North Western | 17.4 |
| 28 | Devon | 17.4 |
| 30 | West 65th | 17.2 |
| 31 | Wentworth | 17 |
| 31 | Armitage | 17 |
| 33 | Broadway | 16.4 |
| 33 | North Central | 16.4 |
| 35 | State | 16 |
| 35 | Jeffery Local | 16 |
| 35 | Skokie | 16 |
| 38 | Kedzie | 15.3 |
| 39 | Ashland Express | 15.2 |
| 39 | Foster | 15.2 |
| 41 | Central | 14.8 |
| 42 | Chicago | 14.6 |
| 42 | Division | 14.6 |
| 44 | California | 14.3 |
| 45 | West 63rd | 14 |
| 45 | California/Dodge | 14 |
| 45 | Pershing | 14 |
| 45 | Damen | 14 |
| 45 | Northwest Highway | 14 |
| 45 | 43rd | 14 |
| 51 | Pulaski | 13.4 |
| 52 | 74th-75th | 13.1 |
| 53 | Western | 13 |
| 53 | South Pulaski | 13 |
| 55 | South Damen | 12.3 |
| 56 | Outer DuSable Lake Shore Expr | 12.1 |
| 57 | Ashland | 11.9 |
| 58 | Archer/Harlem | 11.7 |
| 58 | 69th-UPS Express | 11.7 |
| 60 | Cicero | 11.5 |
| 60 | South Cicero | 11.5 |
| 62 | Clark | 11.1 |
| 63 | Higgins | 11 |
| 63 | Jackson | 11 |
| 63 | 55th/Austin | 11 |
| 63 | Laramie | 11 |
| 63 | Jeffery Manor Express | 11 |
| 68 | Jackson Park Express | 10.3 |
| 69 | North | 10.2 |
| 70 | Jeffery Jump | 10 |
| 70 | Fullerton | 10 |
| 72 | U. of Chicago Hospitals Express | 9.3 |
| 73 | South Kedzie | 9.1 |
| 74 | 67th-69th-71st | 9 |
| 74 | Montrose | 9 |
| 76 | Cermak | 8.2 |
| 77 | Austin | 7.8 |
| 77 | U. of Chicago/Hyde Park | 7.8 |
| 79 | Blue Island/26th | 7.6 |
| 79 | 87th | 7.6 |
| 81 | Michigan/119th | 7.5 |
| 82 | Diversey | 7.3 |
| 83 | Archer | 6.7 |
| 84 | 111th/King Drive | 6.6 |
| 84 | Water Tower Express | 6.6 |
| 86 | Harlem | 6 |
| 86 | South Shore Express | 6 |
| 88 | King Drive | 5.3 |
| 88 | 63rd | 5.3 |
| 90 | Roosevelt | 5.2 |
| 91 | Grand | 5.1 |
| 92 | Pullman/115th | 4.9 |
| 93 | West 103rd | 4.6 |
| 94 | South Michigan | 4.4 |
| 94 | 79th | 4.4 |
| 96 | Belmont | 2.8 |
| 97 | 31st/35th | 2.7 |
| 97 | Lawrence | 2.7 |
| 99 | North Cicero/Skokie Blvd. | 2.4 |
| 100 | Peterson | 2.2 |
| 101 | Irving Park | 2.1 |
| 101 | 95th | 2.1 |
| 103 | 16th/18th | 2 |
| 103 | Cottage Grove | 2 |
| 103 | Garfield | 2 |
| 106 | South Halsted | 1.2 |
| 107 | 47th | 0.3 |
| 107 | Pullman Shuttle | 0.3 |


 Alerts Sign-up